Hi Cloud Documents

Logs Analysis Guide

Introduction to Logs Analysis Using Log Explorer

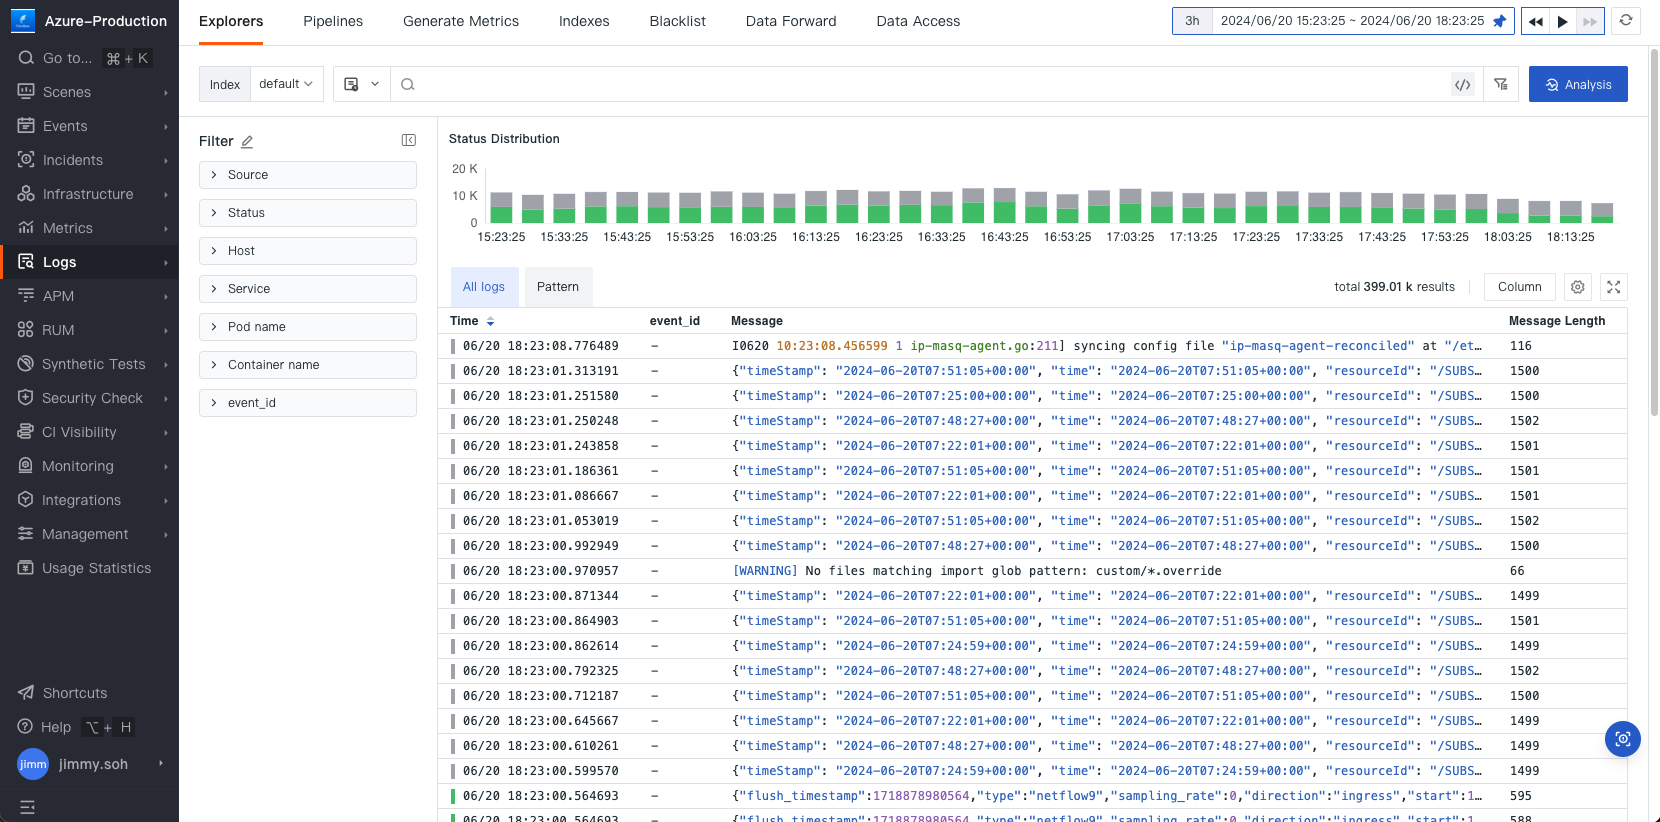
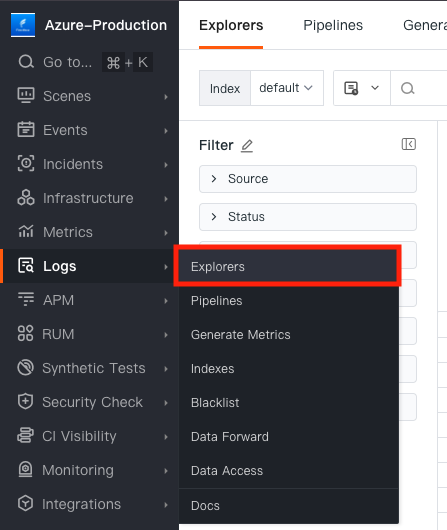
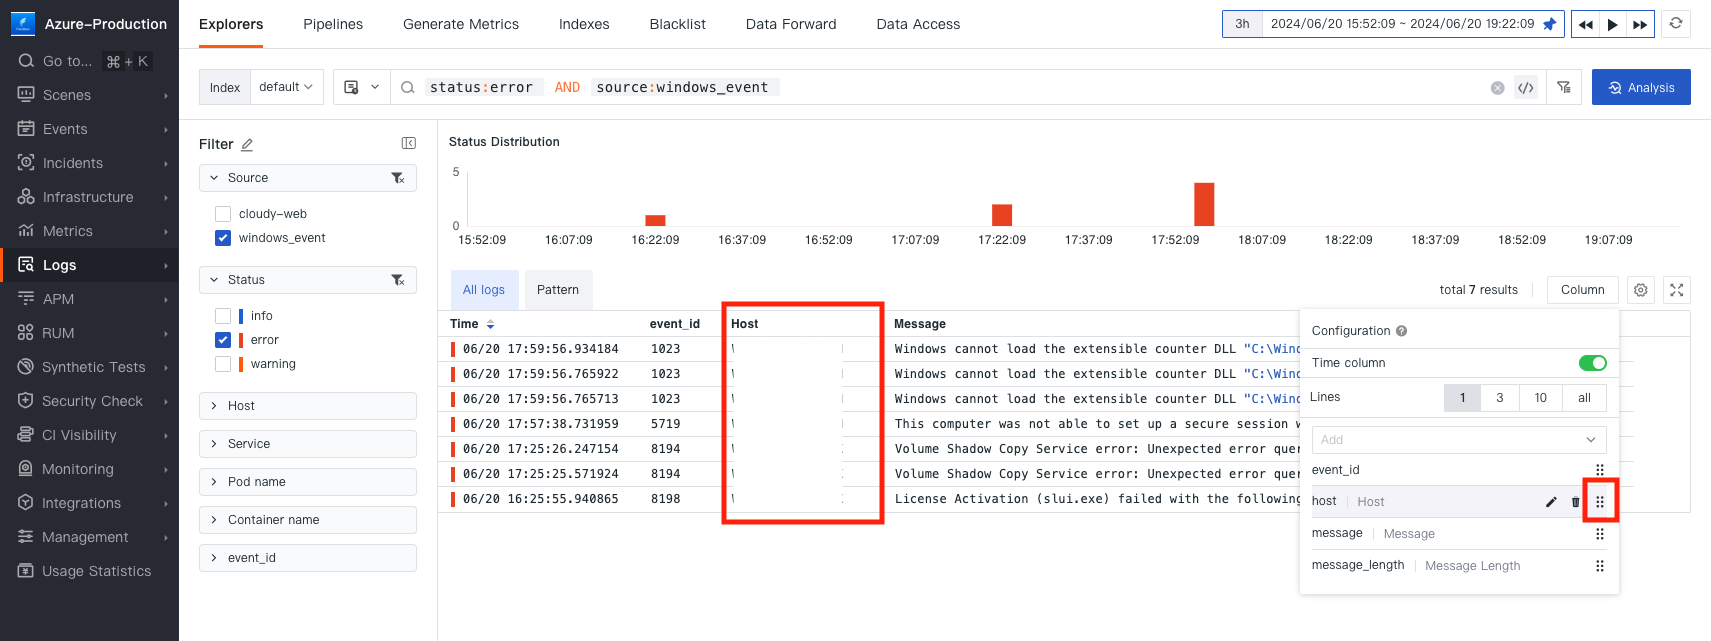
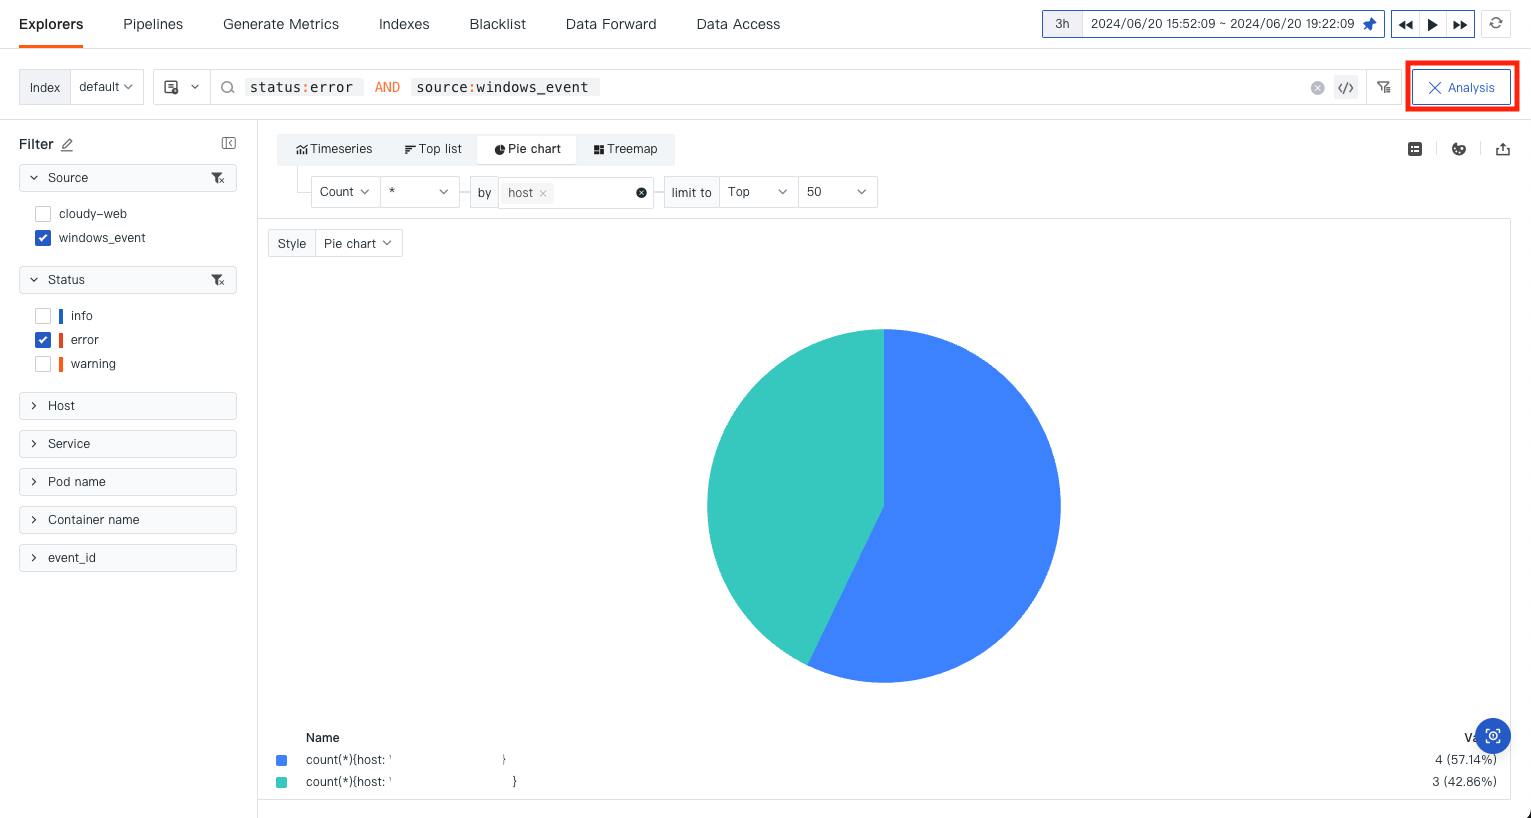
Log Explorer in Multicloud Observability Platform provides robust capabilities for analyzing logs from various sources. This guide introduces the key features of Log Explorer, common use cases, and steps to effectively use the tool for log analysis.

Logs Explorer Overview Screen
Preview

Key Features

  1. Advanced Queries: Use advanced search queries to filter and find specific log entries.
  2. Custom Columns: Customize the display columns to focus on the most relevant log data.
  3. Filters: Apply quick filters to narrow down log data for targeted analysis.
  4. Visualizations: Generate charts and graphs from log data to identify trends and patterns.

Common Use Cases

  1. Error Tracking:
  • Identify and analyze error logs to troubleshoot application issues.
  • Visualize error frequency and distribution to detect recurring problems.
  1. Performance Monitoring:
  • Analyze logs to monitor application performance metrics such as response times and throughput.
  • Use visualizations to track performance trends over time.
  1. Security Analysis:
  • Examine security logs to detect and respond to security incidents.
  • Filter logs to focus on suspicious activities and unauthorized access attempts.

Step-by-Step Guide to Analyzing Logs

  1. Access Log Explorer:
  • Navigate to the "Logs" section in the Multicloud Observability Platform dashboard and click on "Explorer"

Logs Explorer 1

  1. Search and Filter Logs:
  • Use the search bar to enter advanced queries
  • Apply filters to narrow down the log data to specific time frames, log levels, or other criteria
Logs Explorer 2
Preview
  1. Customize Display Columns:
  • Click on the "Columns" button to select the fields you want to display
Logs Explorer 3
Preview
  • Rearrange and resize columns to optimize the view for your analysis
Logs Explorer 4
Preview
  1. Create Visualizations:
  • Use the "Analysis" option to create charts and graphs from the log data
  • Select different visualization types (e.g., bar charts, line graphs) to represent the data effectively
Logs Explorer 5
Preview
  1. Export and Share Insights:
  • Export your search queries and visualizations for future reference
  • Share insights with your team by exporting the data to dashboards and sharing links to specific views
Logs Explorer 6
Preview

Logs Explorer 7

Logs Explorer 8
Preview

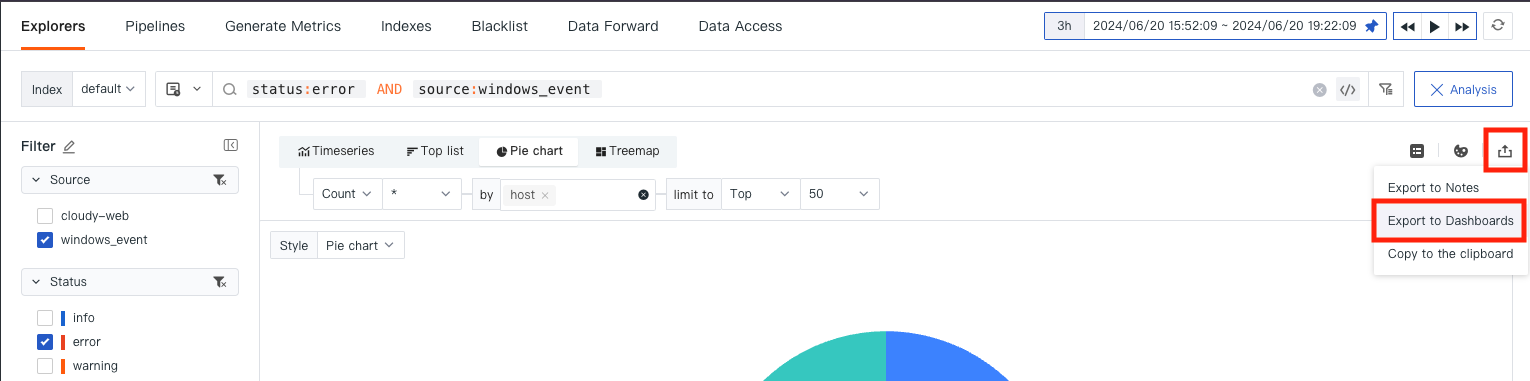
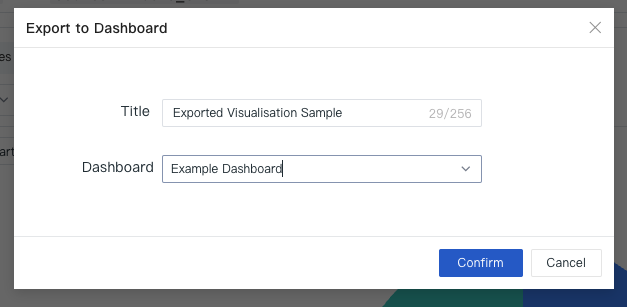
By leveraging these features and following the steps outlined above, you can efficiently analyze logs and gain valuable insights into your application's performance, security, and operational health.

@2025 All rights reserved. Produced by First Wave Technology.