APM (Application Performance Monitoring) tracing in Multicloud Observability Platform provides a means to monitor and analyze the performance of applications by tracking requests as they flow through various services. These traces enable development teams to identify and improve potential application inefficiencies and user experience by providing insights into performance metrics such as latency, errors, and bottlenecks. APM traces also provide information about the behavior of distributed systems, microservices, and serverless architectures.
Multicloud Observability Platform APM includes various tabs for data visualization which your organization can use for a broad overview of information at a glance or detailed analysis for troubleshooting and optimization of your application. You can access the APM features by clicking APM from the left blade or by hovering over it and selecting a page you want to access.
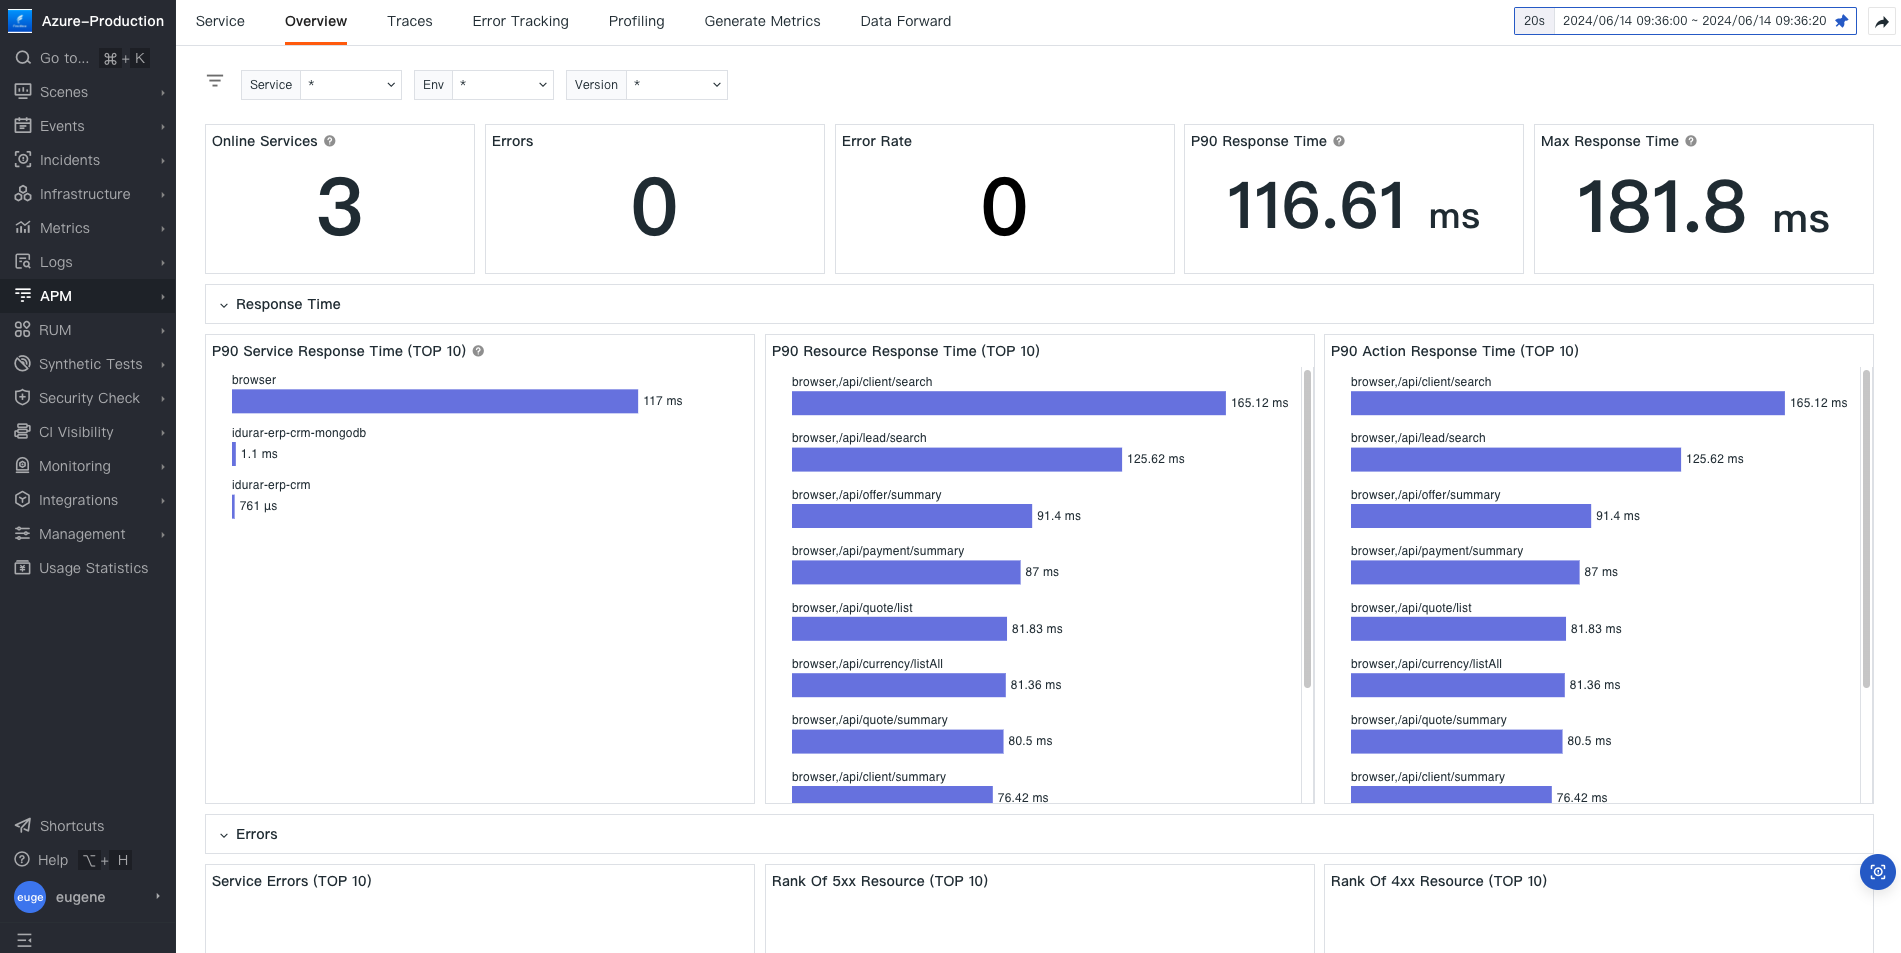
The Overview tab of Multicloud Observability Platform APM tells you the number of online services you are tracking at a specific time period as well as the top 10 resources that have high response times and resources that have 4xx and 5xx response statuses.
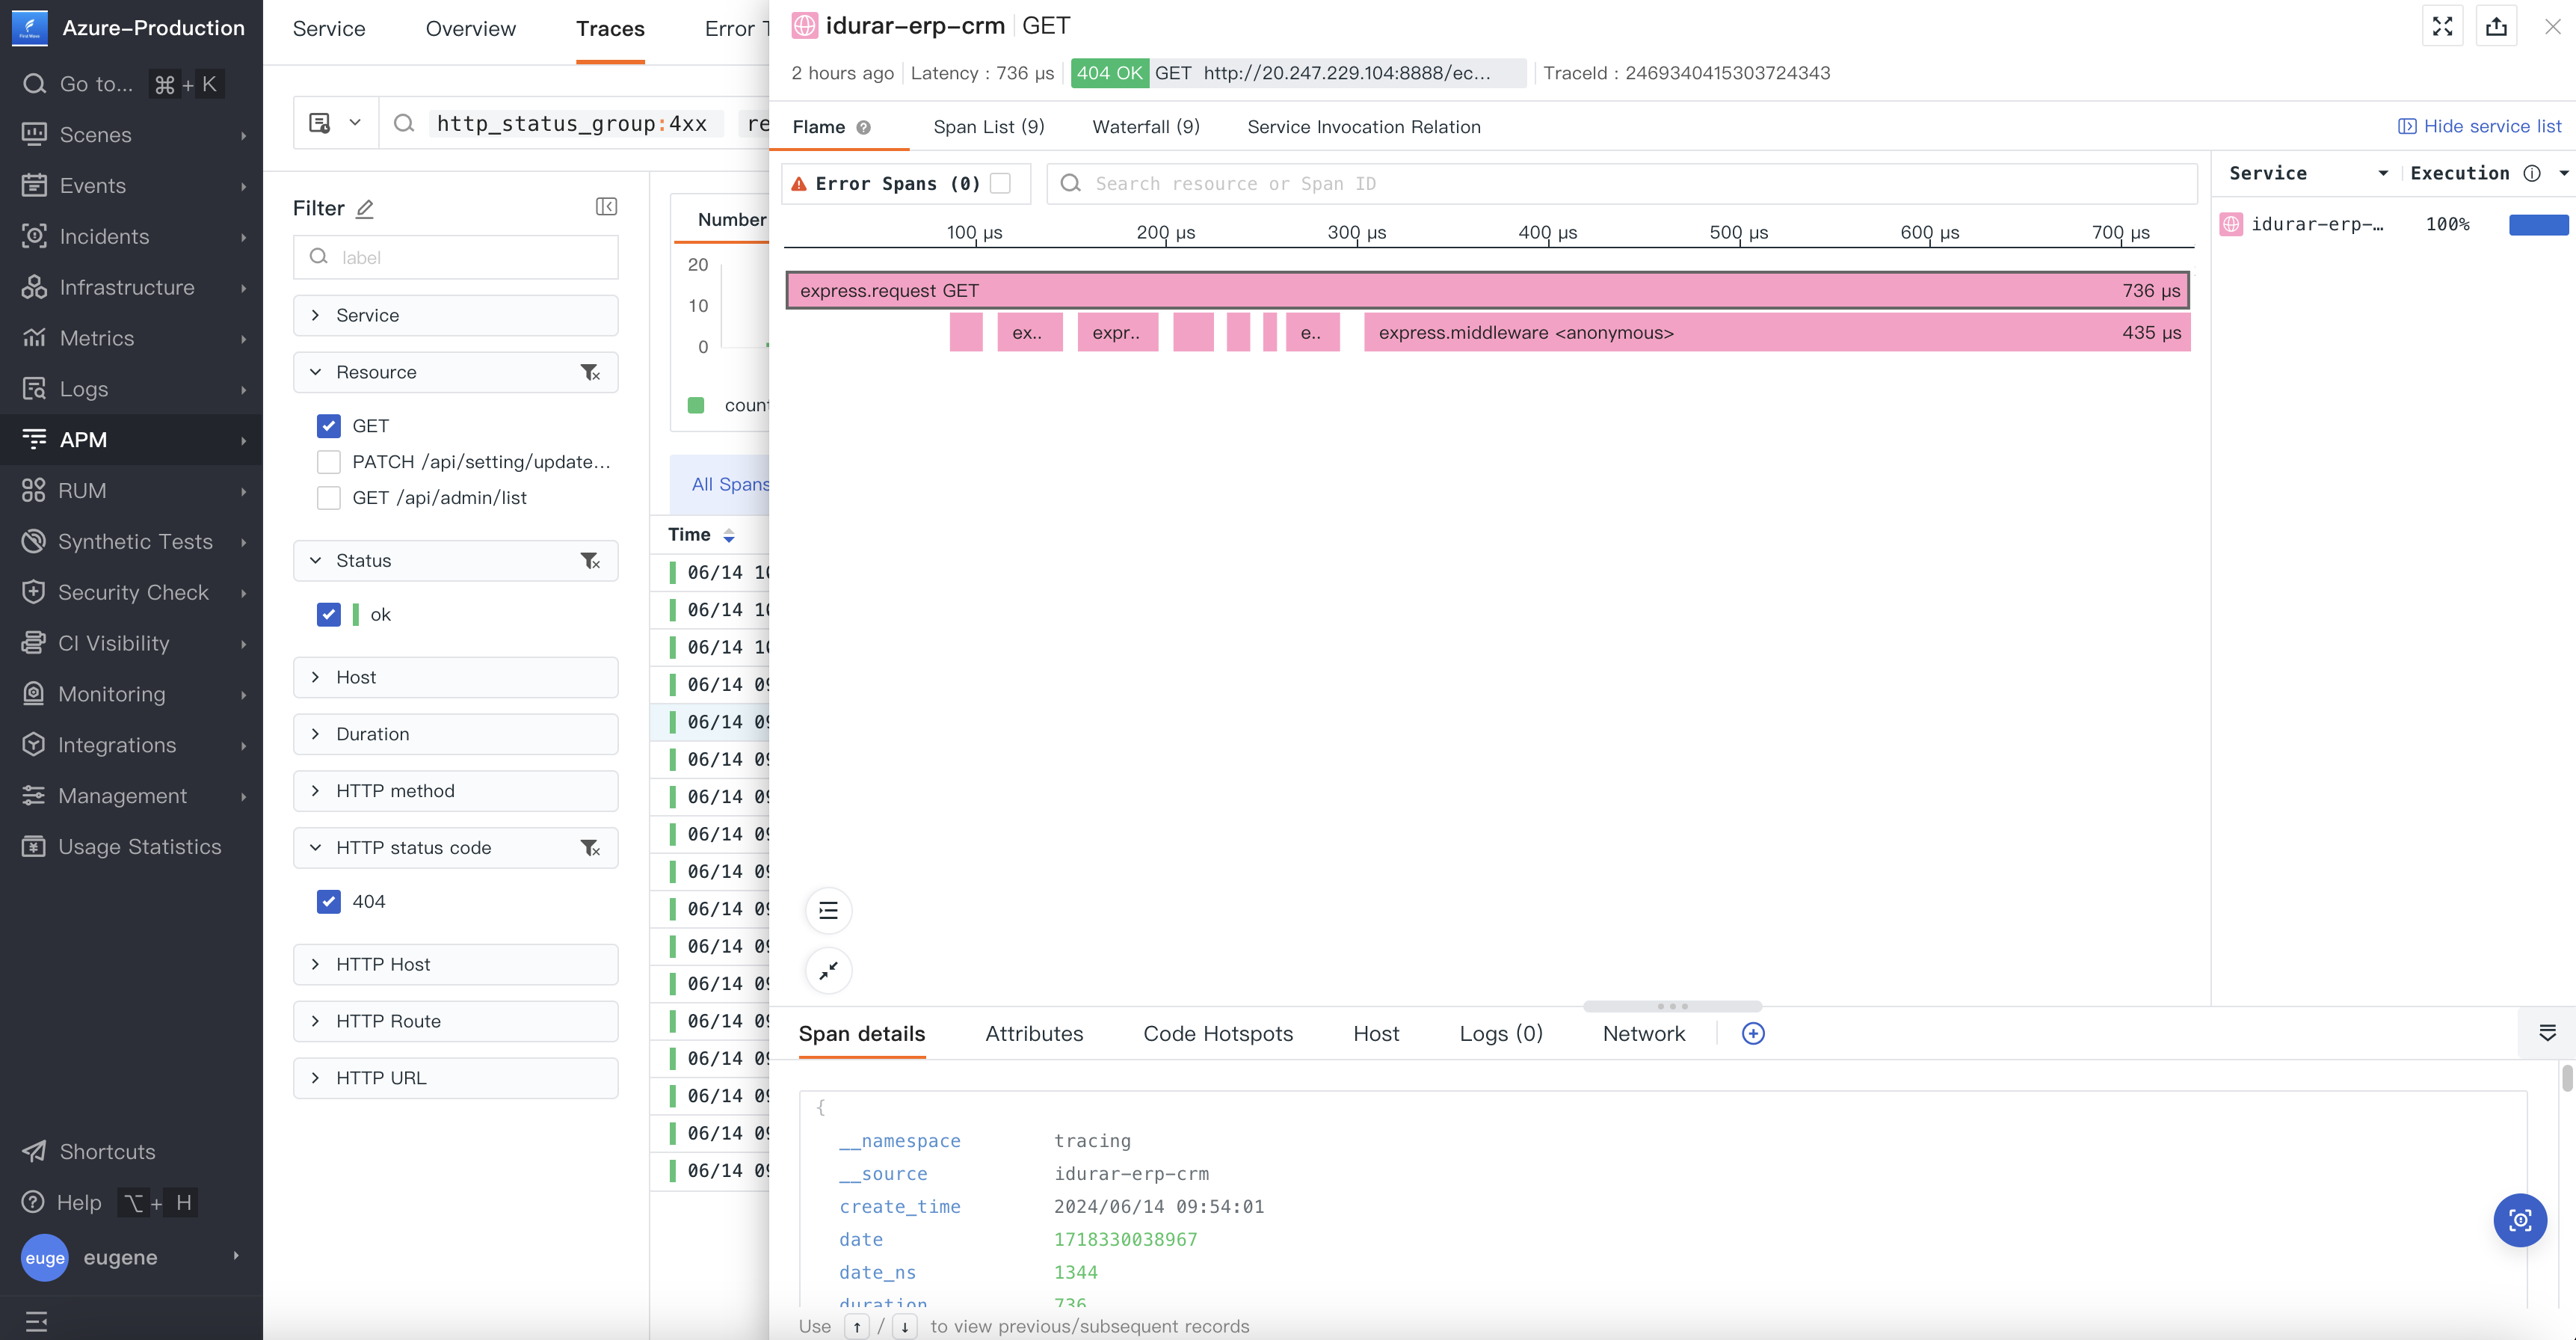
You can use the Traces tab to monitor or troubleshoot application performance issues in depth. The filter function can be used to find the specific type of trace that you are interested in, and you can click on the trace to show the flame chart for the end-to-end network request flow.
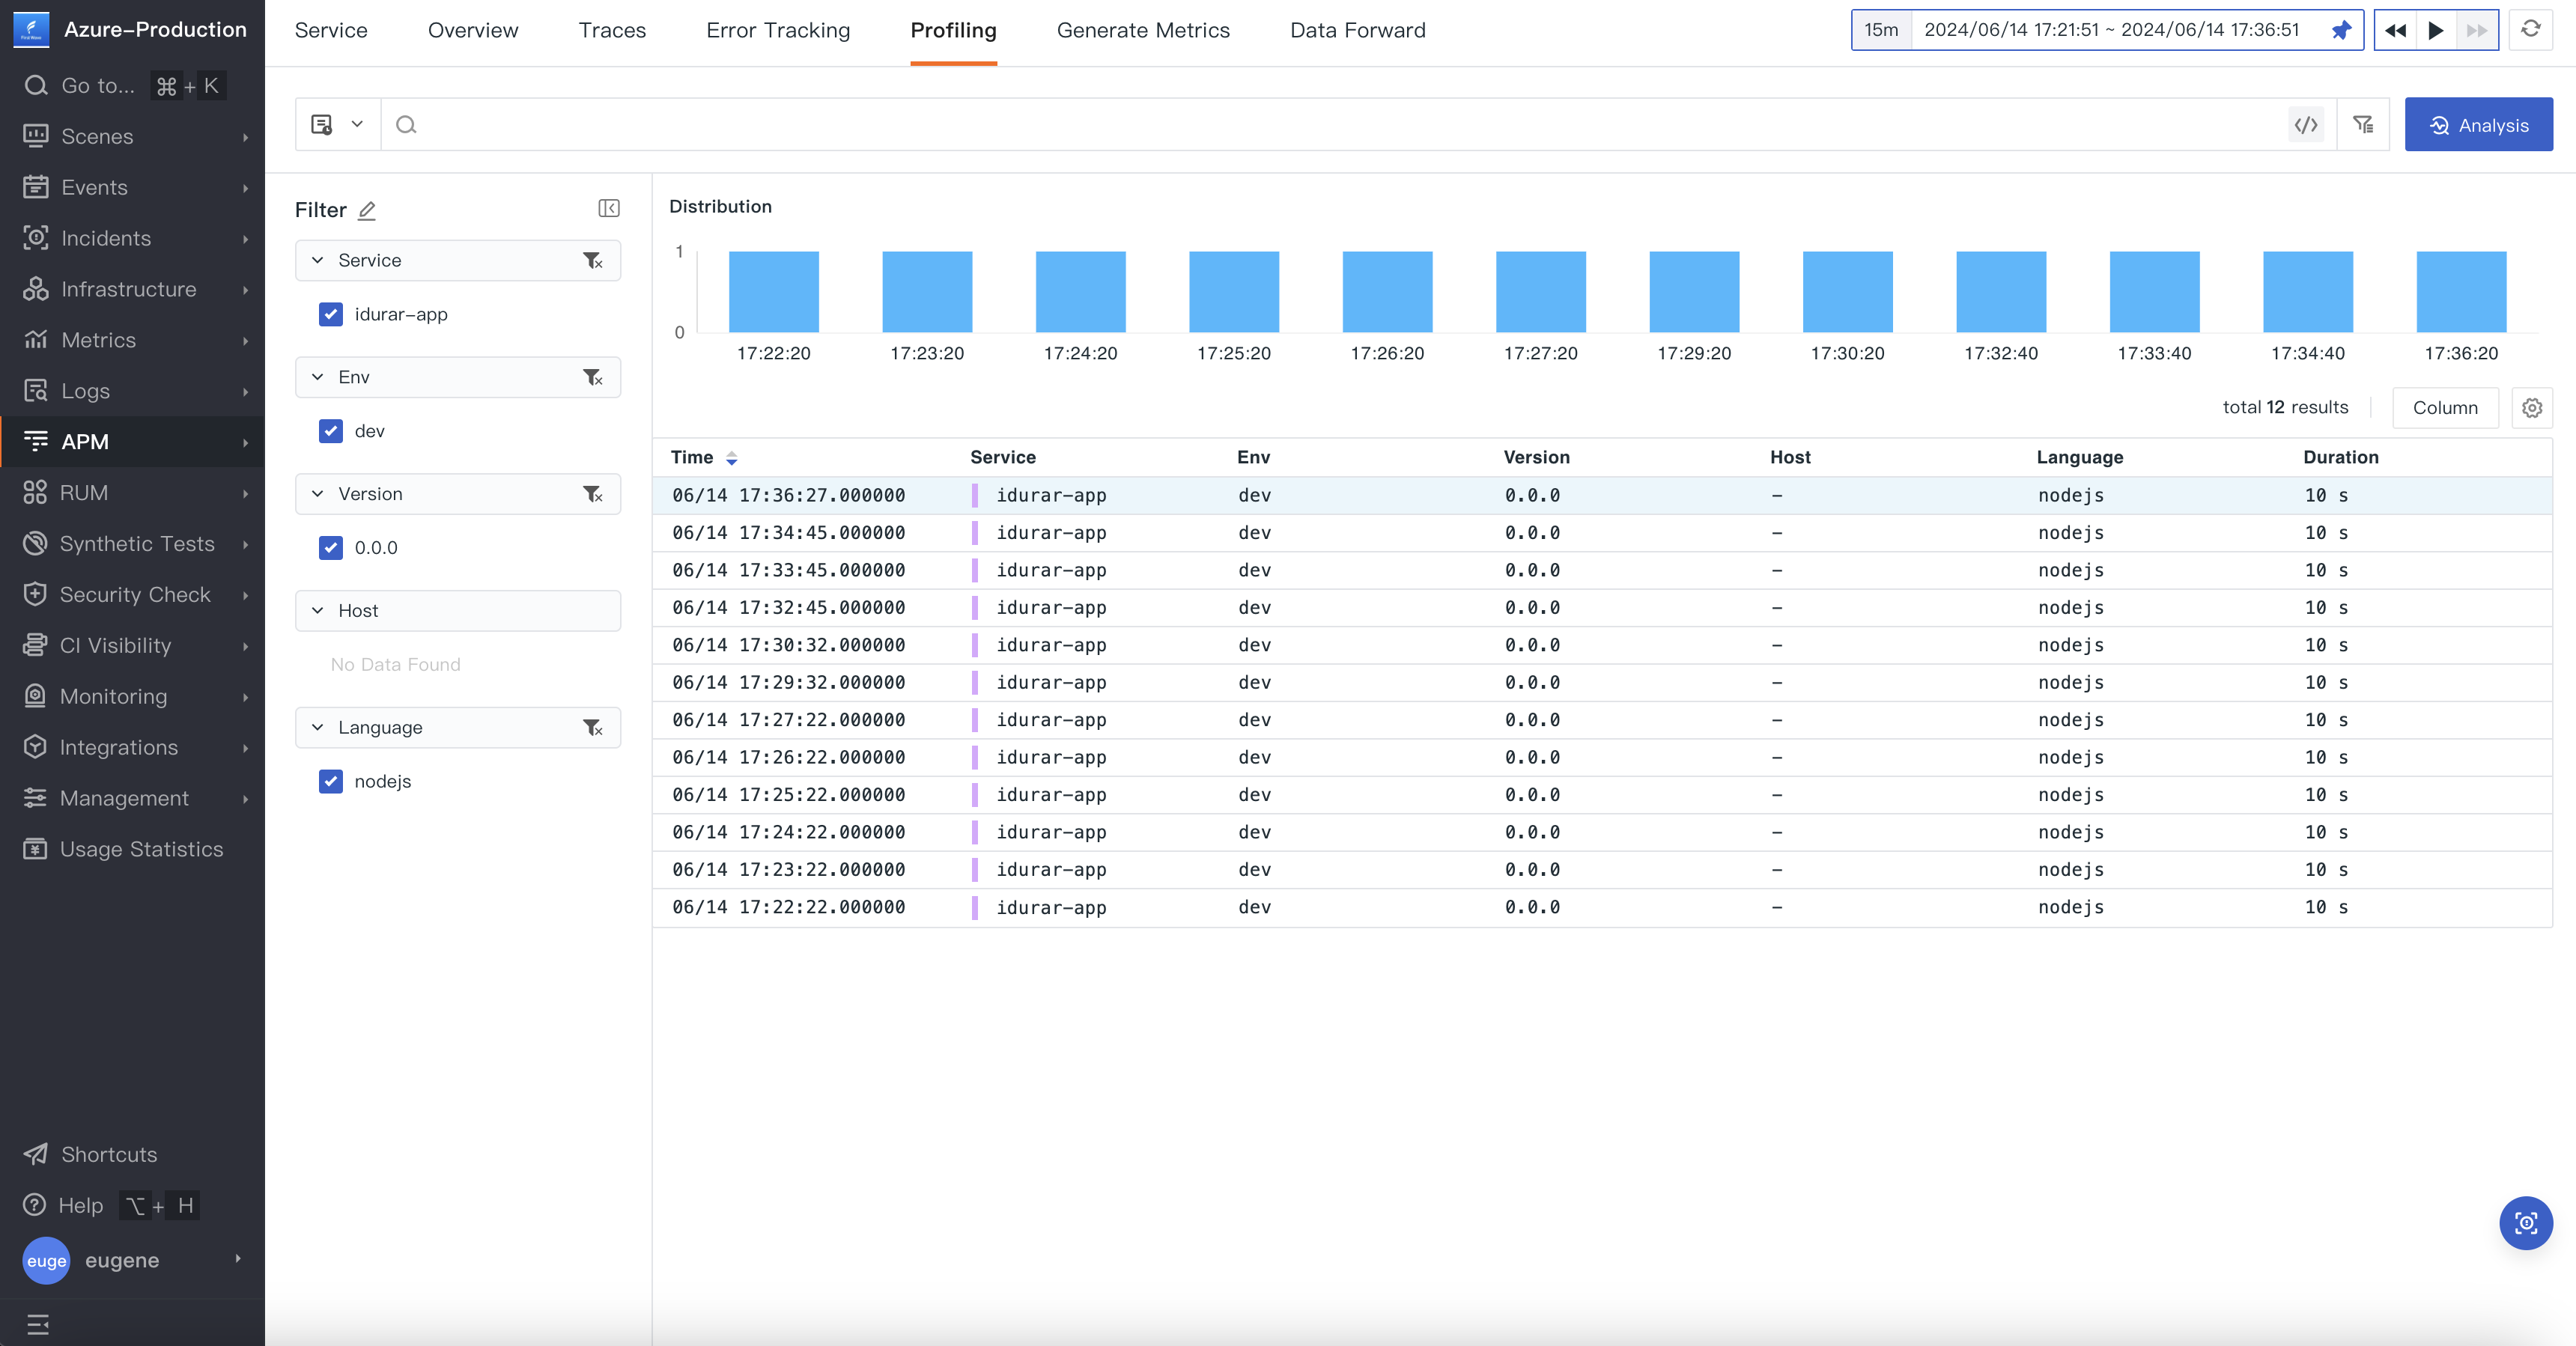
Multicloud Observability Platform supports profiling, which can be accessed under the Profiling tab. It is a powerful tool that can display detailed performance metrics and help identify performance bottlenecks and optimization opportunities in your application.
APM tracing in Multicloud Observability Platform provides powerful tools for monitoring, analyzing, and optimizing application performance. By leveraging the features and capabilities of Multicloud Observability Platform APM, development teams can improve application efficiency, user experience, and overall system performance.

